 See Also

An important part of the process of developing a Unified Communications Managed API version 1.0 application with Unified Communications Managed API version 1.0 is the ability to trace the protocol stack. To do this, you will enable tracing. By viewing the contents of the protocol stack during or after the execution of your code, you can familiarize yourself with the topology of Unified Communications Managed API version 1.0.
 Setting Up a Unified Communications
Managed API version 1.0 SDK Protocol Trace
Setting Up a Unified Communications
Managed API version 1.0 SDK Protocol Trace
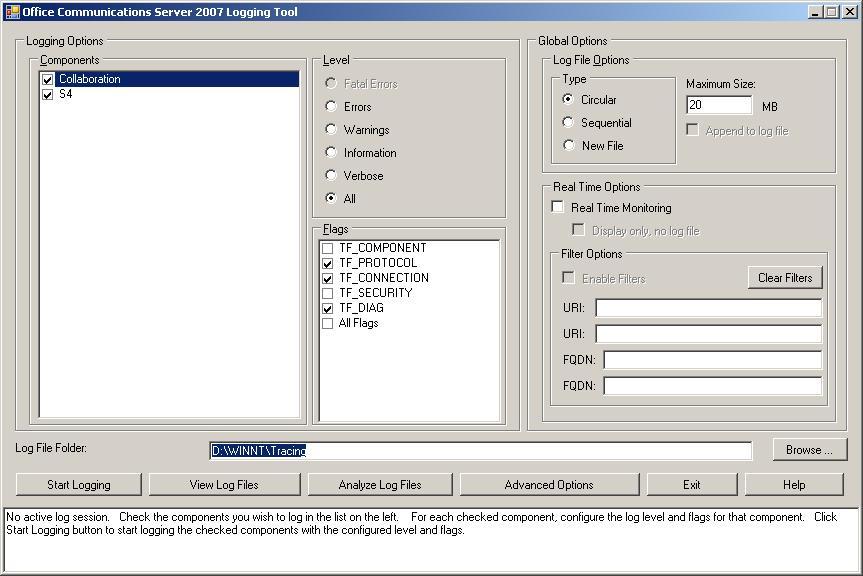
When you install the Unified Communications Managed API version 1.0 SDK, Office Communications Server 2007 Logging Tool (OCSLogger.exe) is located in the \UCMA v1.0\Tracing folder in the Unified Communications Managed API version 1.0 SDK installation directory. Launching the tracing utility opens the Graphical User Interface (GUI) shown in the following figure. Before starting a trace, the user must have done the following:
- Select a trace provider. With the Unified Communications
Managed API version 1.0 SDK, the user must first choose a
component. The default choices are Collaboration and
S4. You can start a trace for each of the components
listed.
- Specify a Symbol path. With Unified Communications
Managed API version 1.0 SDK, the user must specify the path that
points to the Tracing folder. By default, this folder is installed
under the UCMA v1.0 folder created when the Unified Communications
Managed API version 1.0 SDK is installed. By specifying a Symbol
Path, you are enabling text format protocol tracing.
- Define the tracing level. The user must specify the
level of tracing by clicking the appropriate tracing Level
radio button.
Account Permissions
To start a protocol trace you must be a member of the Administrators group on the computer running the protocol trace.
Viewing a Unified Communications Managed API version 1.0 SDK Protocol Trace
You can have a trace running for each of the two trace provider components.
The output of the Office Communications Server 2007 Logging Tool utility is a text file and .ETL files. By default, these files are written to the %WINDIR%\Tracing directory. The S4.txt file in this directory will contain error, warning, and protocol messages. All other output data is contained in the .ETL files and should be sent to Microsoft for further analysis.
Office Communications Server 2007
Logging Tool User Interface
Office Communications Server 2007 Logging Tool presents to users a main dialog and four dialogs available through the Options menu item. These are discussed in detail in the following topics.
Main Dialog
The Office Communications Server 2007 Logging Tool menu bar consists of the following menu items.
| Menu Item | Action |
|---|---|
|
Start Logging/Stop Logging |
Starts logging the specified components, using the options chosen in the user interface. After logging starts, the Start Logging menu item is replaced by Stop Logging. |
|
View Log Files |
Opens the View Log Files dialog box. Click View to convert the log files of the checked components to text and display them. |
|
Analyze Log Files |
Opens the Analyze Log Files dialog box. Click Analyze to analyze the log files of the checked components using Snooper.exe. |
|
Advanced Options |
Opens the Options dialog box, which displays options for formatting buffering, clock resolution, and additional components. These options are described in detail in the following sections. |
|
Exit |
Exits Office Communications Server 2007 Logging Tool. |
|
Help |
Displays Help for Office Communications Server 2007 Logging Tool. |
The remainder of the main dialog consists of panes for Logging Options and Global Options, as well as two text boxes that specify the paths to the log file folder and format file folder.
Logging Options
The Components pane displays two components: Collaboration and S4. Check either one or both to enable logging the selected component(s).
The Level pane allows you to specify the types of messages that are recorded in the log file. The levels are arranged from most restrictive (Fatal Errors) at the top to least restrictive (All) at the bottom. The levels are cumulative, with each level including messages of that type, in addition to messages from all previous levels (that is, levels higher in the list of radio buttons). For example, clicking the Warnings level causes all warning messages to be logged, in addition to all error messages and fatal error messages.
The Flags pane enables you to set the types of messages that are logged. Any combination of the flags shown in the following table can be chosen.
 Note: Note: |
|---|
| Some of the flags are not available for the S4 component. For more information, see the individual flag descriptions in the following table. |
| Flag | Description |
|---|---|
|
TF_COMPONENT |
Log miscellaneous messages not covered by the other trace flag categories. |
|
TF_PROTOCOL |
Log protocol messages or data—SIP or CCCP messages. Other components can also log their text-based messages. |
|
TF_CONNECTION |
Log connection-related errors or warnings. Information on connections established to and from a particular component, etc. This can also include significant network-level information for components that do not have the concept of a "connection." Not available in the S4 component. |
|
TF_SECURITY |
Log all events or log entries related to security. For example, for SipStack, these include log security events such as domain validation failure and others, client authentication or authorization failures, and others. Not available in the S4 component. |
|
TF_DIAG |
Log diagnostics events that can be used to diagnose or troubleshoot the component. For example, for SipStack, these include certificate failures or errors, or DNS warnings or errors. Not available in the S4 component. |
|
All Flags |
Log messages in all categories. |
Global Options
The Log File Options pane contains the Type pane and the Maximum Size text box, which determine how new log records are inserted into the log file and its size. Choose Circular to indicate that when a log file reaches its maximum size, new records are to be placed at the beginning. Choose Sequential to indicate that new records should be placed at the end of the log file. Choose New File to start a new log file.
The Real Time Options pane contains a check box for Real Time Monitoring and, if Real Time Options is checked, a check box for Display only, no log file operation.
The Filter Options pane enables a user to restrict logging to specified URIs or fully-qualified domain names (FQDN), each of which requires input validation. When filtering is used, the log files will contain information only from the URIs or FQDNs listed in the URI and FQDN text boxes. Filtering can be applied to two user URIs, or two machine FQDNs (or IP addresses), or one URI and one FQDN. Click Clear Filters to clear the contents of the URI and FQDN text boxes.
The Log File Folder text box specifies the folder in which to write log files. By default this is %WinDir%\Tracing\.
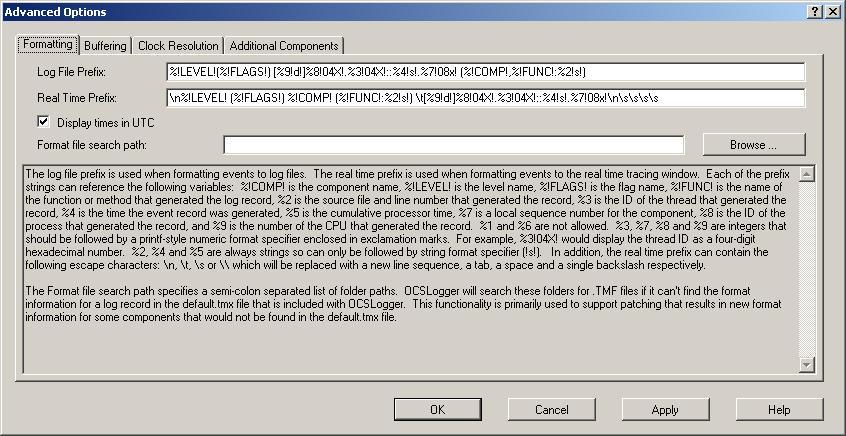
Advanced Options Dialog—Formatting Tab
The Formatting tab of the Advanced Options dialog box enables the user to determine the information that appears in log records, and how the information is formatted.
The Log File Prefix text box is used for formatting events that are written to log files. The Real Time Prefix text box is used for formatting events to the real-time tracing window.
The Display times in UTC check box determines whether times in log records are displayed in Coordinated Universal Time (UTC) (checked), or system time (unchecked).
The Format file search path text box specifies a semicolon-separated list of folder paths. OCSLogger searches for .TMF files in these paths if it is unable to find format information for a log record in the default.tmx file that is included with OCSLogger. This functionality is used primarily to support patching that results in new format information for some components, where that information is not present in default.tmx.
The variables used in log file formatting are shown in the following table.
| Variable | Description |
|---|---|
|
%!COMP!% |
The component name. |
|
%!LEVEL!% |
The level name. |
|
%!FLAGS!% |
The flag name. |
|
%!FUNC!% |
The function or method that generated the log record. |
|
%1 |
Not used. |
|
%2 |
The source file and line number that generated the log record. |
|
%3 |
The ID of the thread that generated the log record. |
|
%4 |
The time when the log record was generated. |
|
%5 |
The cumulative processor time. |
|
%6 |
Not used. |
|
%7 |
A local sequence number for the component. |
|
%8 |
The ID of the process that generated the log record. |
|
%9 |
The number of the CPU that generated the log record. |
The numeric variables (%n) can be followed by a
printf-style format specifier. For example,
%3!04X! displays the thread ID as a four-digit
hexadecimal number, %7!08X! displays the thread ID as
an eight-digit hexadecimal number, and %9!D! displays
the CPU number as an integer. The %2, %4, and %5 variables
represent string quantities, so if a format specifier is used, it
must by one pertaining to strings, such as !s!.
After setting logging prefixes and the time to use in this dialog box, click OK to save your changes, or Cancel to discard them. If you click Apply, you can open another Advanced Option page on which to make changes. Clicking Cancel undoes any changes you have made since you clicked Apply.
Advanced Options Dialog—Buffering Tab
The Buffering tab of the Advanced Options dialog box enables the user to set the buffer size, minimum and maximum number of buffers, and the Real time display flush timer, which specifies how often to flush the buffer in real-time logging. The default values are 64 KB for the buffer size, 20 and 40, respectively, for the minimum and maximum numbers of buffers, and 10 seconds for Real Time Flush timer.
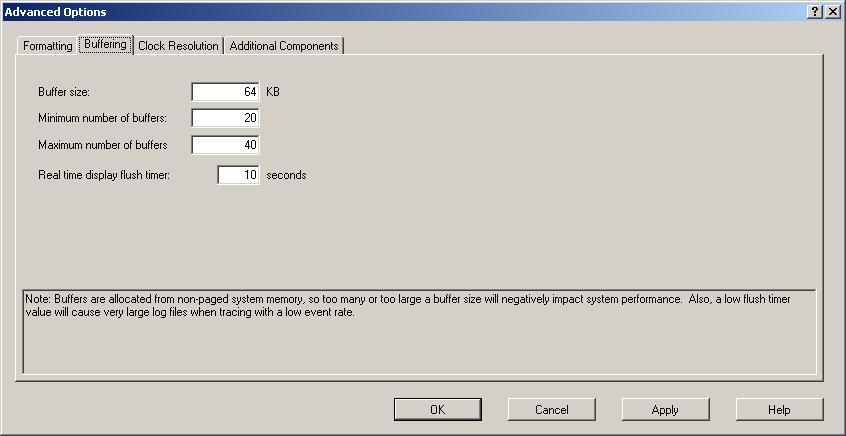
After setting the buffer size and the minimum and maximum numbers of buffers, and the timer, click OK to save your changes, or Cancel to discard them. If you click Apply, you can open another Advanced Option page on which to make changes. Clicking Cancel undoes any changes you have made since you clicked Apply.
Advanced Options Dialog—Clock Resolution Tab
The Clock Resolution tab of the Advanced Options dialog box enables the user to specify the resolution of time stamps in log records. The choices are 10 milliseconds (the lowest resolution), 100 nanoseconds, or CPU frequency (the highest resolution).
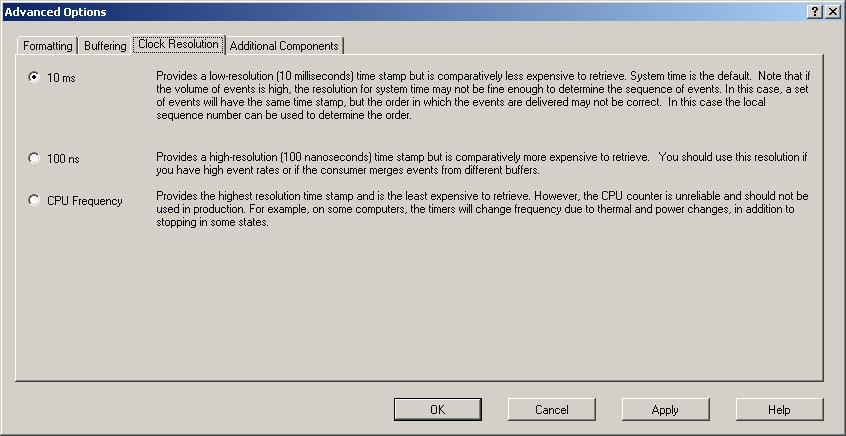
After setting the clock resolution in this dialog box, click OK to save your changes, or Cancel to discard them. If you click Apply, you can open another Advanced Option page on which to make changes. Clicking Cancel undoes any changes you have made since you clicked Apply.
Advanced Options Dialog—Additional Components Tab
The Additional Components tab of the Advanced Options dialog box enables the user to specify additional components on which to log events. Enter the path for the component in the upper text box. Enter the name of the executable in the lower text box. Multiple paths and multiple executable files can be entered.
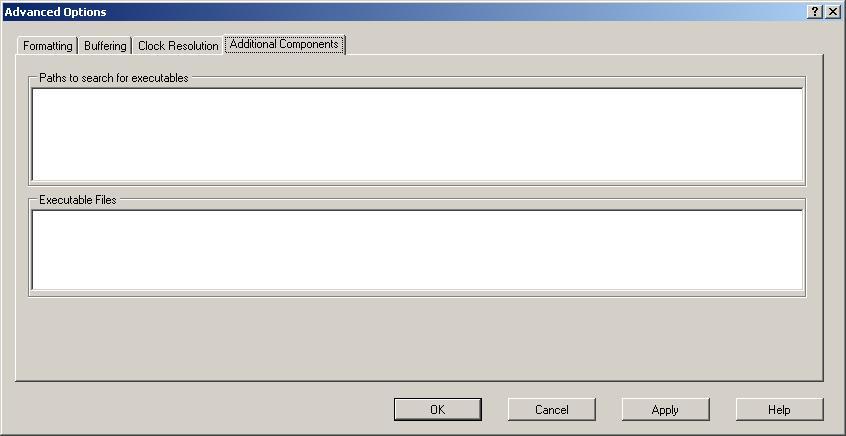
After entering the paths and executable files in this dialog box, click OK to save your changes, or Cancel to discard them. If you click Apply, you can open another Advanced Option page on which to make changes. Clicking Cancel undoes any changes you have made since you clicked Apply.