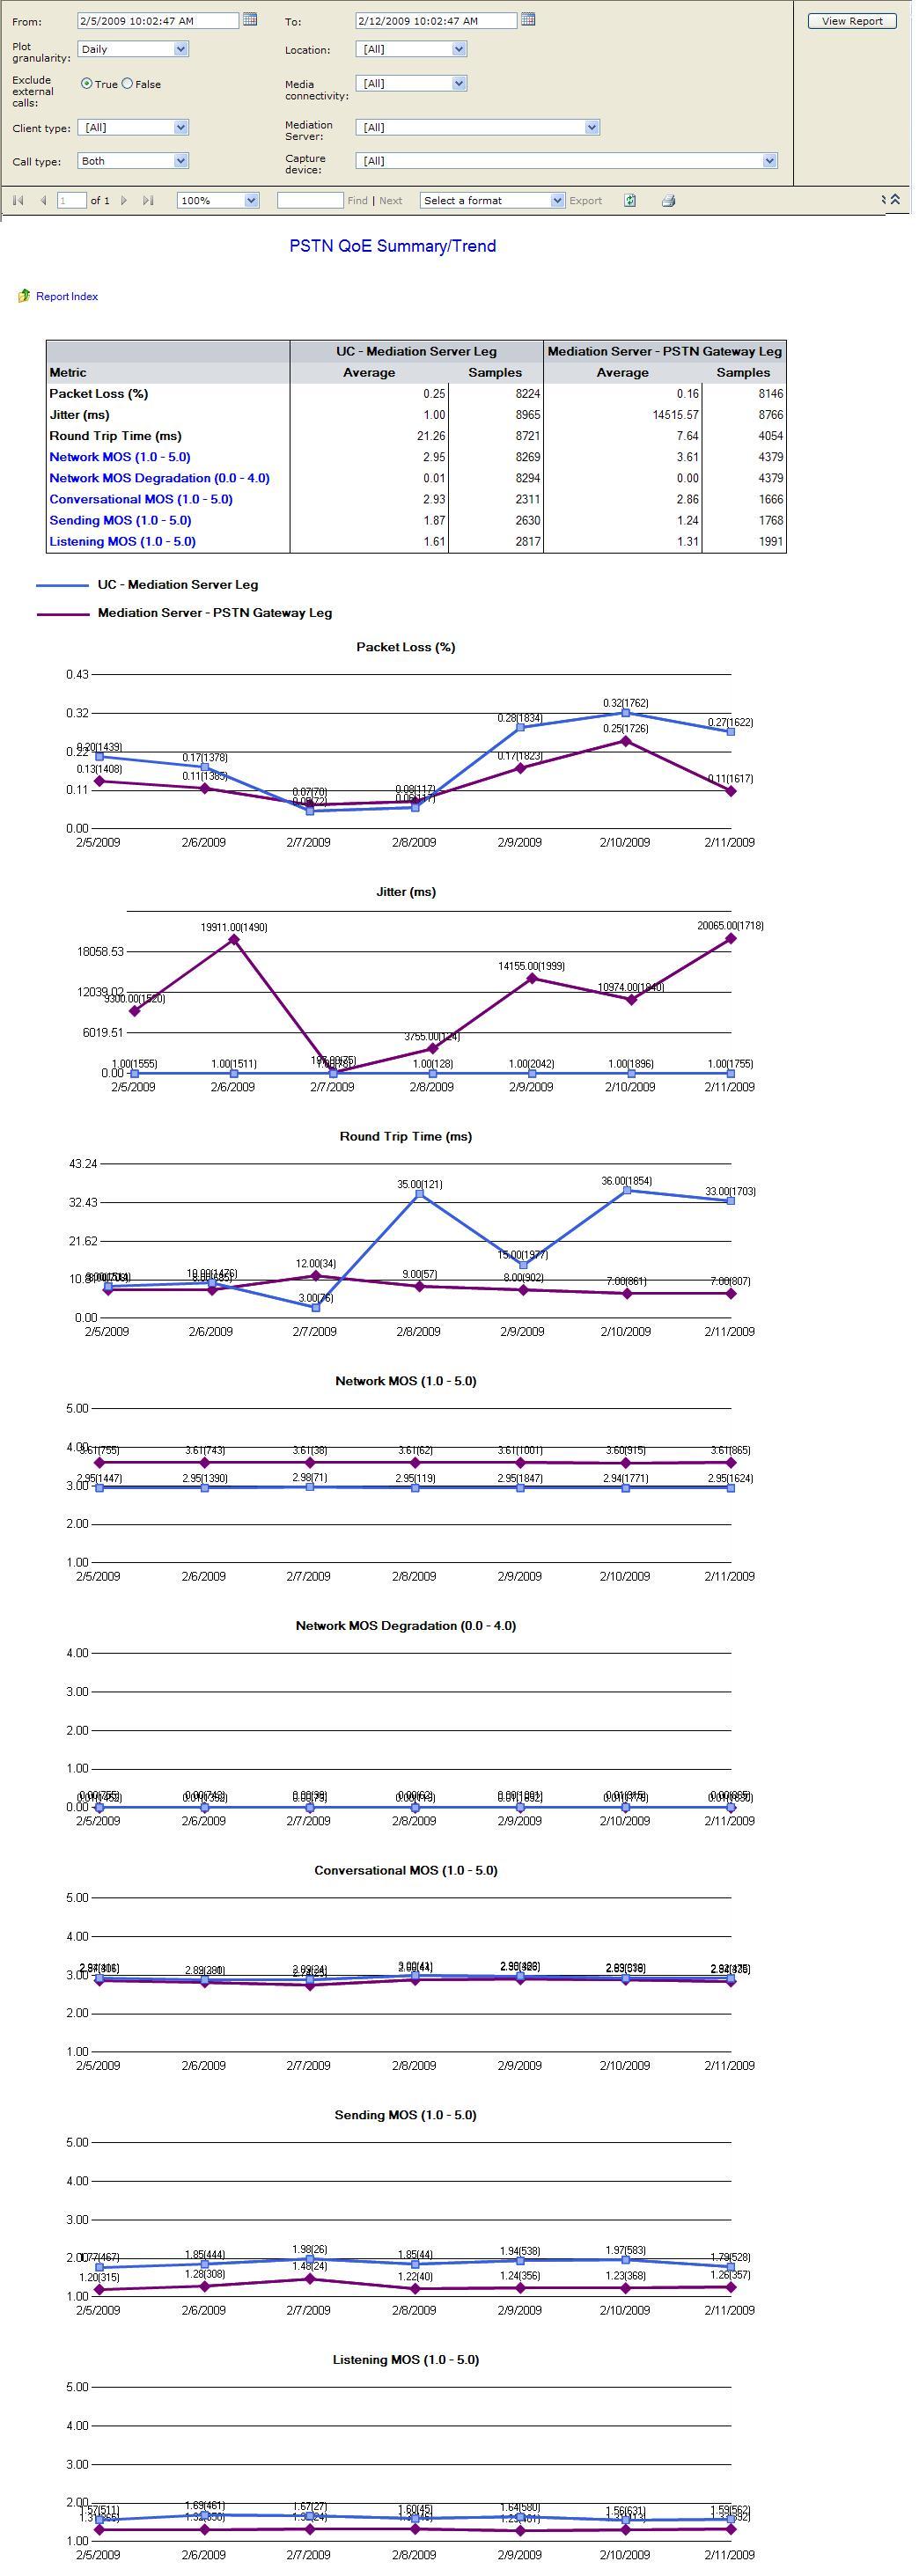
The PSTN Summary/Trend report shows a snapshot of the higher-level media-quality trends in unified communications-to-public switched telephone network (UC-to-PSTN) and public switched telephone network-to-unified communications (PSTN-to-UC) calls in the network. It includes the following metrics:
- Packet Loss
- Jitter
- Round Trip Time
- Network MOS
- Network MOS Degradation
- Conversational MOS
- Sending MOS
- Listening MOS
At the top of the report, each of these metrics is shown in a summary table. Below the table are graphs for each metric, plotted according to the granularity specified in the report. Each plot point in the graphs is labeled with the number of samples reported during that time period, as well as the average value of those samples. Each graph shows separate plot points and trend lines for the UC-Mediation Server leg and the Mediation Server-Gateway leg of calls. You can click each plot point in the graph to see a call list for the period represented by that plot point.
In the table at the top of the main report, you can click the Network MOS, Network MOS Degradation, Conversational MOS, Sending MOS, or Listening MOS to see a graph that shows the distribution of scores for that metric.
 Important: Important: |
|---|
| The jitter values reported for the Mediation Server-PSTN Gateway leg of calls may be abnormally high and inaccurate due to interoperability issues between OCS Mediation Server and some PSTN Gateways. Consistently high jitter values (more than thousands of ms between a the Mediation Server and the gateway) can result from this issue. |
 Note: Note: |
|---|
| In general, a sample size of less than 30 has too large a margin of error to provide a useful mean opinion score (MOS). |

 Filters
You can view the report with a granularity of hourly, daily, weekly, or monthly. Daily and hourly trends can be useful to see how the network performs during peak daily usage, while weekly and monthly rates can help you see longer-term trends, especially as new users are added or network hardware is updated.
The number of points to be plotted must be between 2 and 24. If you choose a granularity and start and end times that would cause there to be more than 10 points to be plotted, the report will truncate the end time to make it fit within the plot point limit.
Additionally, you can filter the data in this report based on the following:
-
Exclude External Calls.Select this to exclude calls where
either the sender or receiver are located outside of the enterprise
network. Note that this is
Trueby default; select
Falseto include external calls in the report.
-
Client Type.Use this filter to view the quality of calls on
specific client types, such as Office Communicator, Office
Communicator Phone Edition, or Office Communications Server 2007 R2
Attendant.
-
Call Type.Use this filter to select the direction of calls:
PSTN-to-UC, UC-to-PSTN, or both.
-
Location.Use this filter to view data from only a specific
location or subnet.
-
Media Connectivity.Use this to choose only calls that are
directly connected (that is, by users within the enterprise), or
calls that use the A/V Edge service or the HTTP Proxy to be
connected (that is, calls that involve external users).
-
Mediation Server.Use this to choose only calls that go
through a specific Mediation Server. This filter can be
particularly useful for isolating faults on the Mediation
Server-gateway leg of calls.
-
Capture Device.Use this filter to view the quality of calls
on specific devices and versions. The items in this list are
generated by parsing the Quality of Experience (QoE) reports stored
in the Monitoring Server database.
 Scenario
- You are receiving a lot of complaints about UC-to-PSTN calls
having audio cut-out and distortion. You might examine the PSTN
Summary\Trends report and find no overall performance issues.
However, if you filter to each particular Mediation Server, you
might find high packet loss in calls handled by one particular
Mediation Server, and thus discover the source of the problem.
- You receive many complaints over a short time with similar
symptoms, and you check the Summary/Trends report, but the overall
numbers do not indicate any issues. You notice that many of the
complaints come from users in a certain building, so you use the
Summary/Trends
Location Scopefilter to examine only the calls for that
building, and you find low network-related numbers in that
building. Subsequent investigation might reveal an overloaded wide
area network (WAN) link servicing that building.


 See Also