Topic Last Modified: 2014-03-12
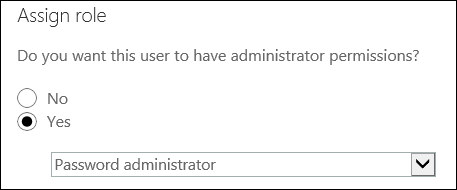
To access the Lync Online reports, log on to the Office 365 administrator portal (https://portal.microsoftonline.com/admin/default.aspx) using your Lync Online user account and password. The account you use to log on must be assigned either the Global administrator or the Password administrator user role in order to view the reports. To verify whether an account has been assigned one of these roles, do the following:
-
In the Office 365 admin center, click users and groups.
-
Click the display name of the account to be checked.
-
On the account properties page, click Settings.
-
Any administrator role assigned to the account will be shown under the Assign role heading:
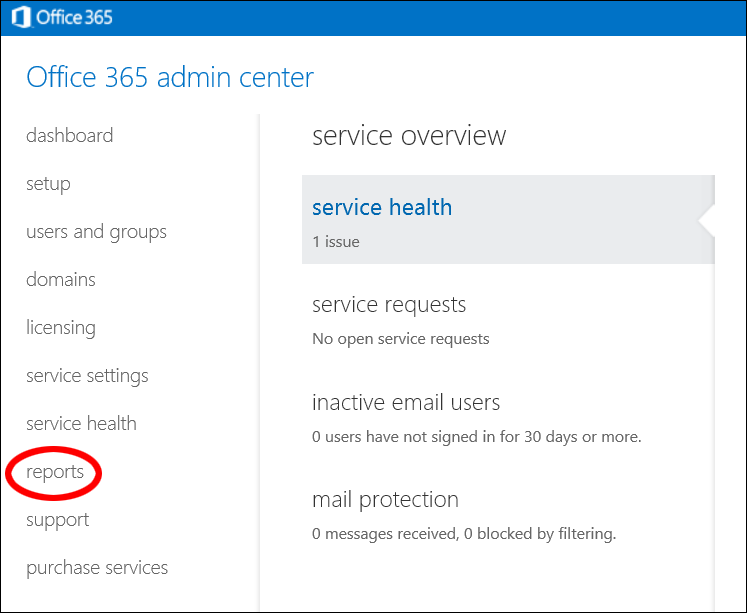
After you have logged on, click the reports heading found on the portal home page:
And then, on the reports page, click the Lync heading:
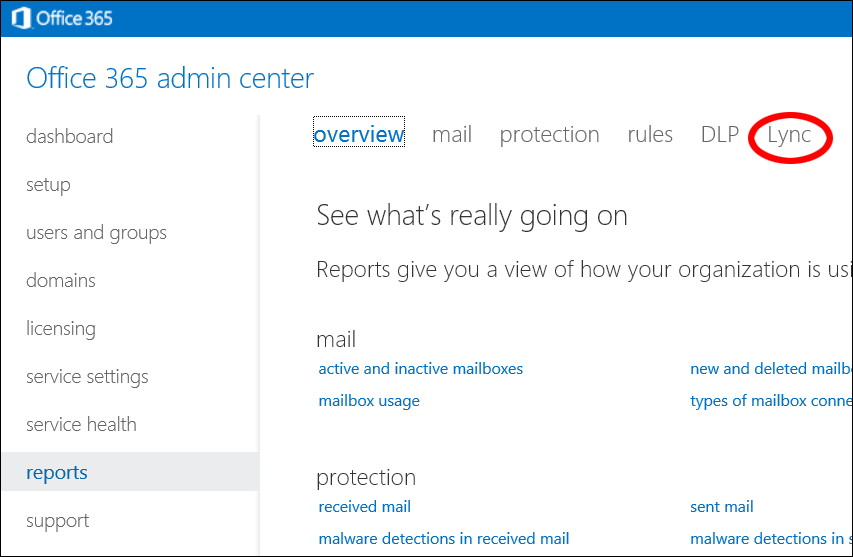
In turn, the Office 365 admin center will display all the Office 365 reports on a single page:
 Note: Note: |
|---|
| You can also click on individual reports from the collection of reports shown on the overview tab. (The Lync Online reports are located near the bottom of the page; you might have to scroll down until you see the Lync heading. As you might expect, if you click one of the links the admin center will display the selected report. However, the other Lync Online reports will not be displayed on that same page. To view a different report, you need to go back to the reports page and select the new report. Although the information is the same, administrators wanting to look at multiple reports will find it faster and easier to view those reports from the Lync page. |
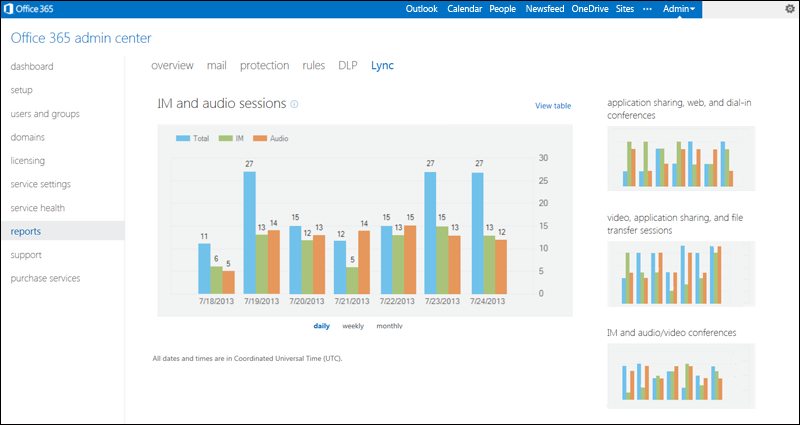
By default, the admin center displays a large-scale view of the IM and audio sessions report, along with thumbnail views of the remaining Lync Online reports:
-
Video, application sharing, and file transfer sessions
-
IM and audio/video conferences
-
Application sharing, web, and dial-in conferences
 Note: Note: |
|---|
| The IM and Audio Sessions Report and The Video, Application Sharing, and File Transfers Report return information about peer-to-peer sessions: communication sessions involving just two users. The IM and Audio/Video Conferences Report and The Application Sharing, Web, and Dial-in Conferences Report return information about Lync Online conferences: communication sessions involving three or more users. |
If you would like to see a close-up view of one of these other reports, simply click the appropriate thumbnail. For example, if you click Application sharing, web, and dial-in conferences your screen will change accordingly:
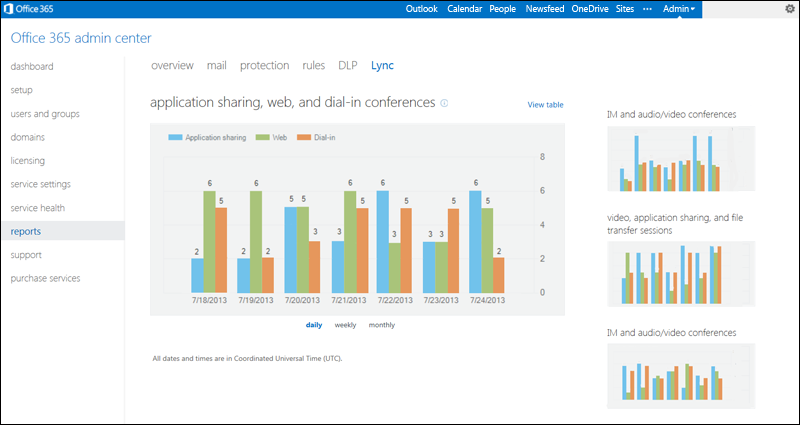
Each time you select a new report the admin center defaults to showing you the “daily view.” In daily view, you see statistics for the previous 7 days (not including the current date). For example, if you are viewing reports on June 21, 2013 you will see daily statistics for the 7 days between June 14, 2013 and June 20, 2013, inclusive:

Alternatively, you can choose to view weekly or monthly statistics: to switch between views simply click the daily, weekly, or monthly links located directly beneath the graph. With the weekly view, you see aggregate statistics for the previous 8 weeks, including the current week (a week begins on Sunday at 12:00 AM and ends on Saturday at 11:59 PM):

If you decide to view monthly statistics you’ll see aggregate values for the past six months:

Note that the range of dates displayed in the Lync Online reports are configured by the report itself and cannot be modified. For example, suppose the current date is June 21, 2013 and you would like to review the data for the April 6, 2013. There is no way to configure the reports to review that data: in the daily view, you can only see the preceding 7 days, meaning that you will not be able to see data for April 6, 2013. If you need to review data that falls outside the date ranges imposed by the reports, you can use the Lync Online reporting cmdlets instead. Administrators with a development background can also take advantage of the REST (Representational State Transfer) web service in order to programmatically access the Lync Online reporting data.
By default each Lync Online report is displayed as a graph. If you prefer to view this data in tabular format click the View table link located at the upper right-hand corner of the graph. In turn, the admin center will display your Lync Online data in a popup table similar to this:
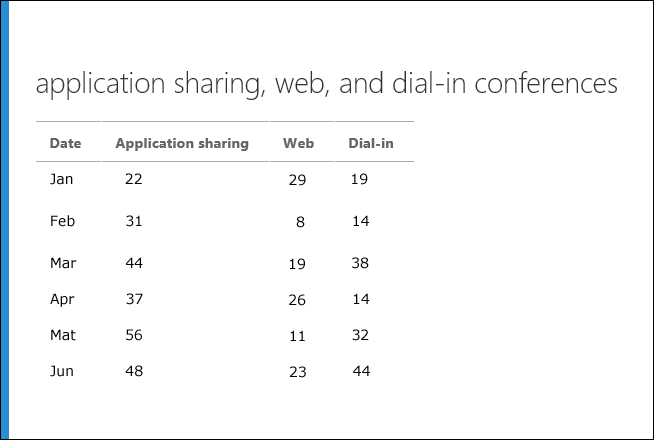
This is the exact same data that is displayed in the graph. One advantage to the table format, however, is the fact that this data can be selected, copied, and then pasted into another application (such as Excel). To do that, use your mouse to select the data in the table, then either press Ctrl-C or right-click and then click Copy in order to copy the information to the clipboard. The copied data can then be pasted into an application such as Excel:
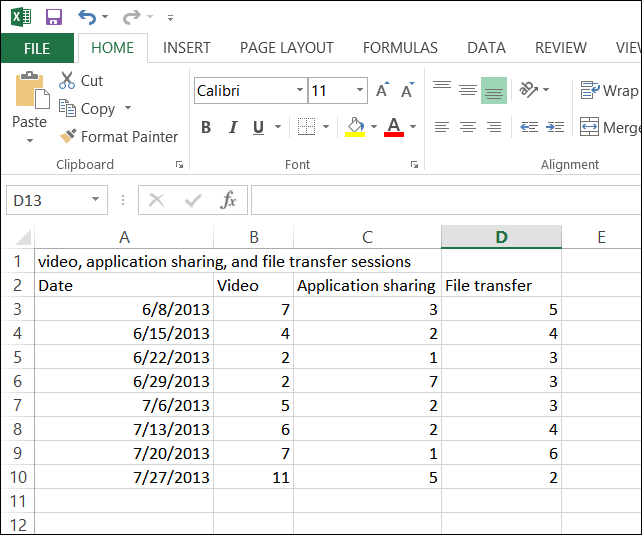
At this point in time, this is the only way to export Lync Online data from the Office 365 admin center: there is no option for saving or exporting information from the Lync Online reports.
 Note: Note: |
|---|
| Periodically copying and pasting data from the reports also provides a way for you to maintain your own database Lync Online activity. As noted previously, if today’s date is March 20, 2014 then there is no way to use the admin center to view daily activity for January 6, 2014; that’s because the January 6th data is too old to appear in the report. If you are comfortable using Windows PowerShell then that information can be retrieved by using the Lync Online reporting cmdlets. Alternatively, by periodically copying data to a spreadsheet or database you can make it very easy to look up statistics for any given date. |

